Richard Drury
It was an exciting week on Wall Street and for the markets in general. The CPI came in warmer than expected, but the PPI cooled from last month. Also, we saw some initial earnings, with several big banks providing mixed results. The initial rate-cut probabilities continued to be pushed out further, with the July rate-cut odds decreasing to about 50/50.
We also witnessed a geopolitical escalation, as Iran sent hundreds of drones and rockets at Israel (over 99% were shot down) in a coordinated multisided attack. Israel has vowed to retaliate, which could lead to a broader conflict in the region.
Therefore, we've seen a tick-up in volatility, markets are on edge, and there is debate about whether valuations have become expensive for the current economic environment. Additionally, the technical image has been ripe for a correction for some time.
The VIX Comes Roaring Back
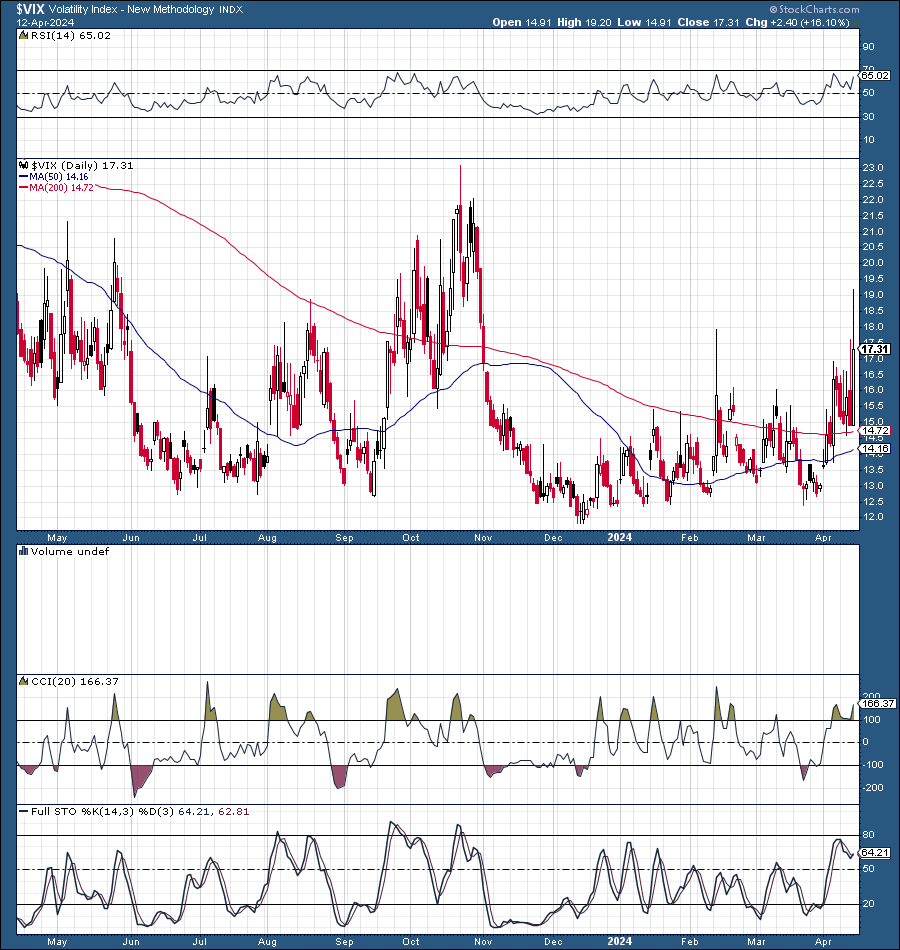
VIX (stockcharts.com )
The S&P VIX Index (VIX) has been relatively subdued since late last year, but we've seen higher lows (mostly) and higher highs developing lately. Finally, the VIX blasted to over 19, its highest level since last year's correction. While the VIX pulled back below 18, we could have another spike above 20, as volatility could persist due to technical, fundamental, and psychological factors in the near term.
SPX - Why The Selloff Could Continue
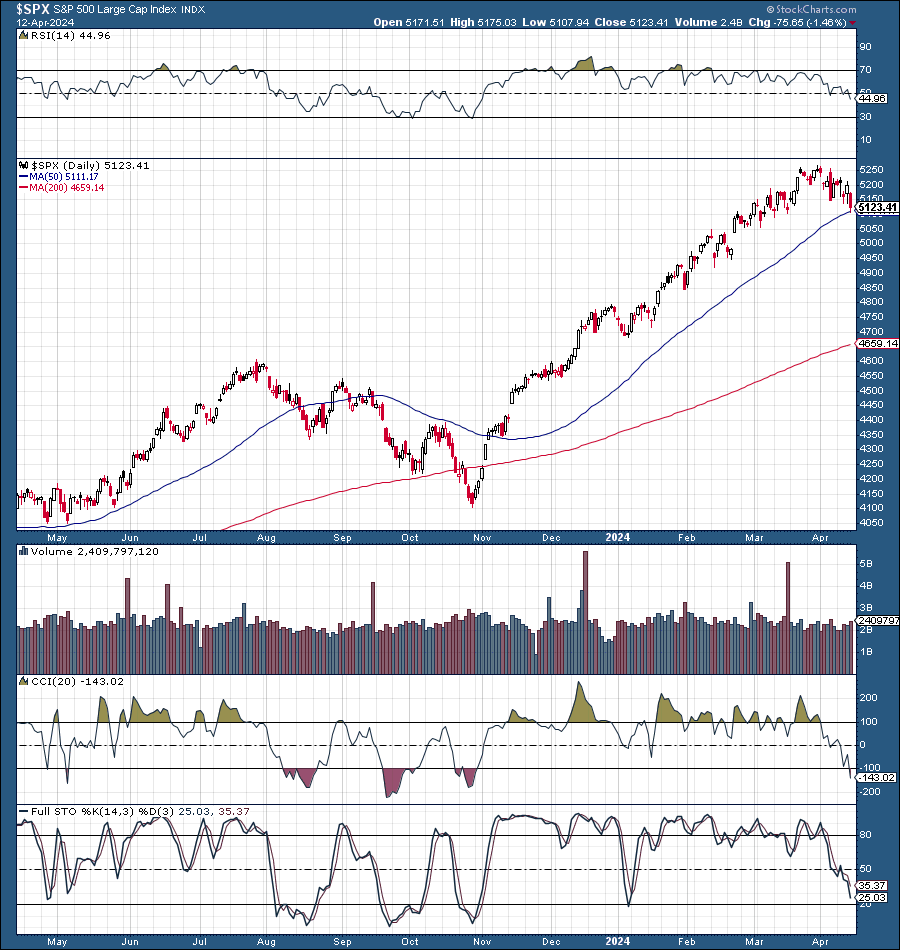
The SPX (stockcharts.com )
We've discussed the S&P 500's (SP500, SPX) worsening technical momentum as the RSI started making noticeably lower highs despite higher price action from stocks. The SPX also got way above its 200-day MA, and other technical gauges implied that a pullback was close.
After about a 30% surge since the October 2023 correction bottom, the SPX has given back about 2.5% from its ATH, which is not much. Provided all the factors, the pullback could continue, with a "base-case" buy-in range around the 5,000-4,700 zone. This dynamic implies we could see a 5-10% correction from the recent ATH around 5,250 in the SPX.
Also, we should remember that corrections are healthy and necessary phenomena required to bring technical conditions and valuations back in line, setting the market up for its next leg higher and a move toward my 5,700-6,000 SPX range by year-end.
Recent Data - A Mixed Bag
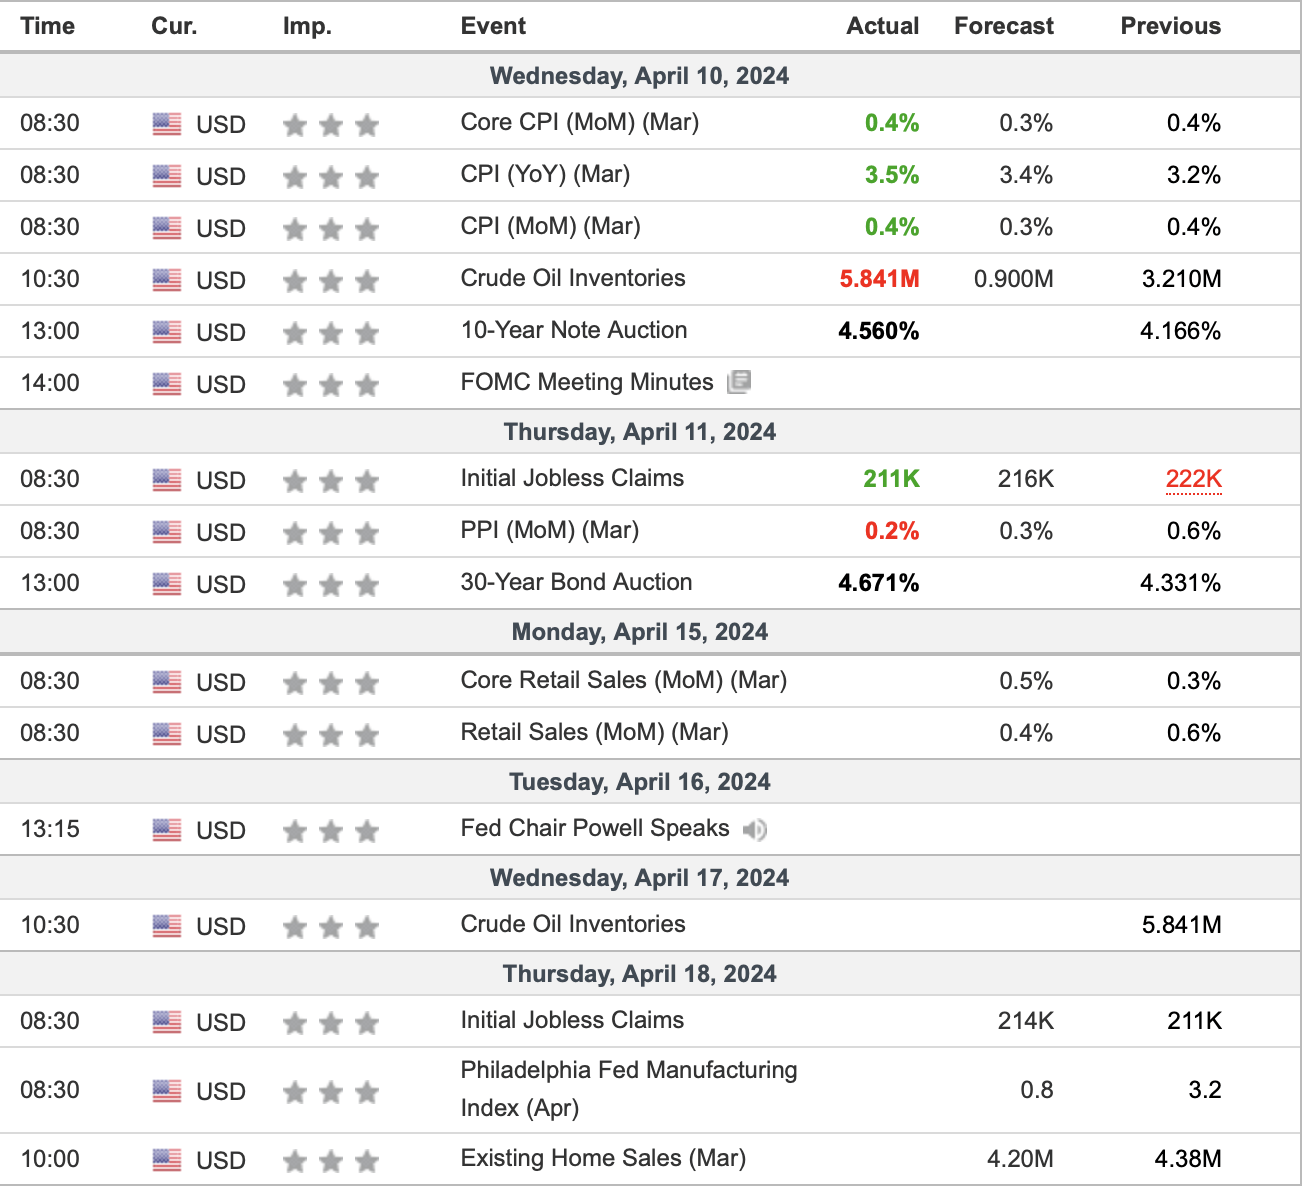
Economic data (investing.com )
The CPI inflation data were slightly warmer than expected, which is the primary reason for the continued shift to a "higher for longer" monetary policy. In this recent article, I explained why I don't view the CPI as a crucial inflation gauge relative to other inflation readings. Nonetheless, we've seen the CPI up more than expected for several months, which is something we must watch closely now.
On the bright side, the PPI (producer inflation) came in lower than expected, suggesting that the inflation figures could offset each other. Also, a lower PPI implies lower inflation for producers, which could translate to lower consumer inflation in the coming months.
Truflation Continues Below 2%
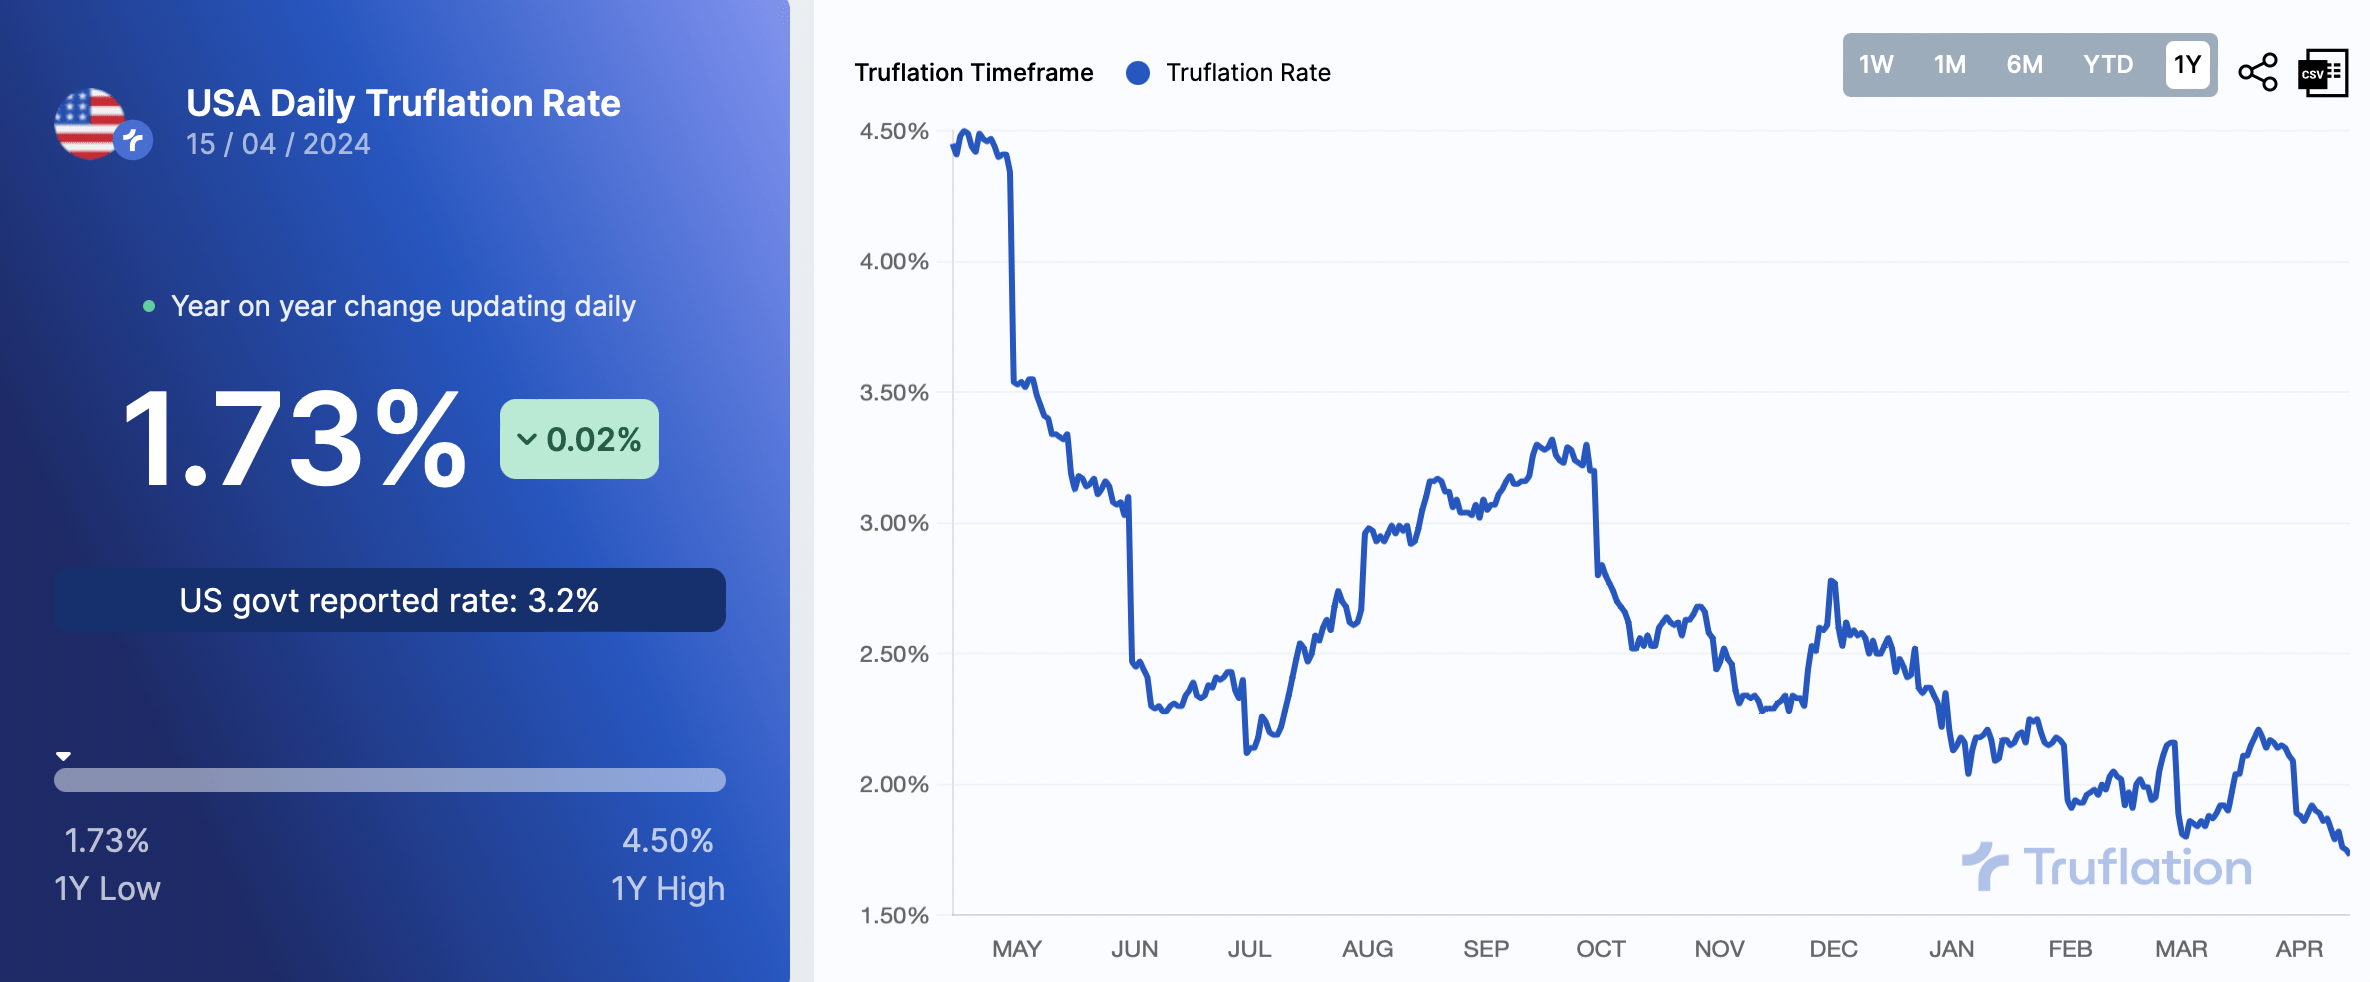
Truflation inflation (truflation.com )
Truflation, an independent, non-government, real-time (not lagging) inflation gauge, shows U.S. inflation around 1.73%, below the Fed's 2% target rate. There is a considerable disconnect between Truflation's 1.73% and the government's reported 3.2% reading. Still, I believe the government's way of measuring inflation is outdated and has a more considerable lag effect than Truflation, and actual inflation may be closer to 2%.
Nonetheless, Rate Cut Odds Are Shifting
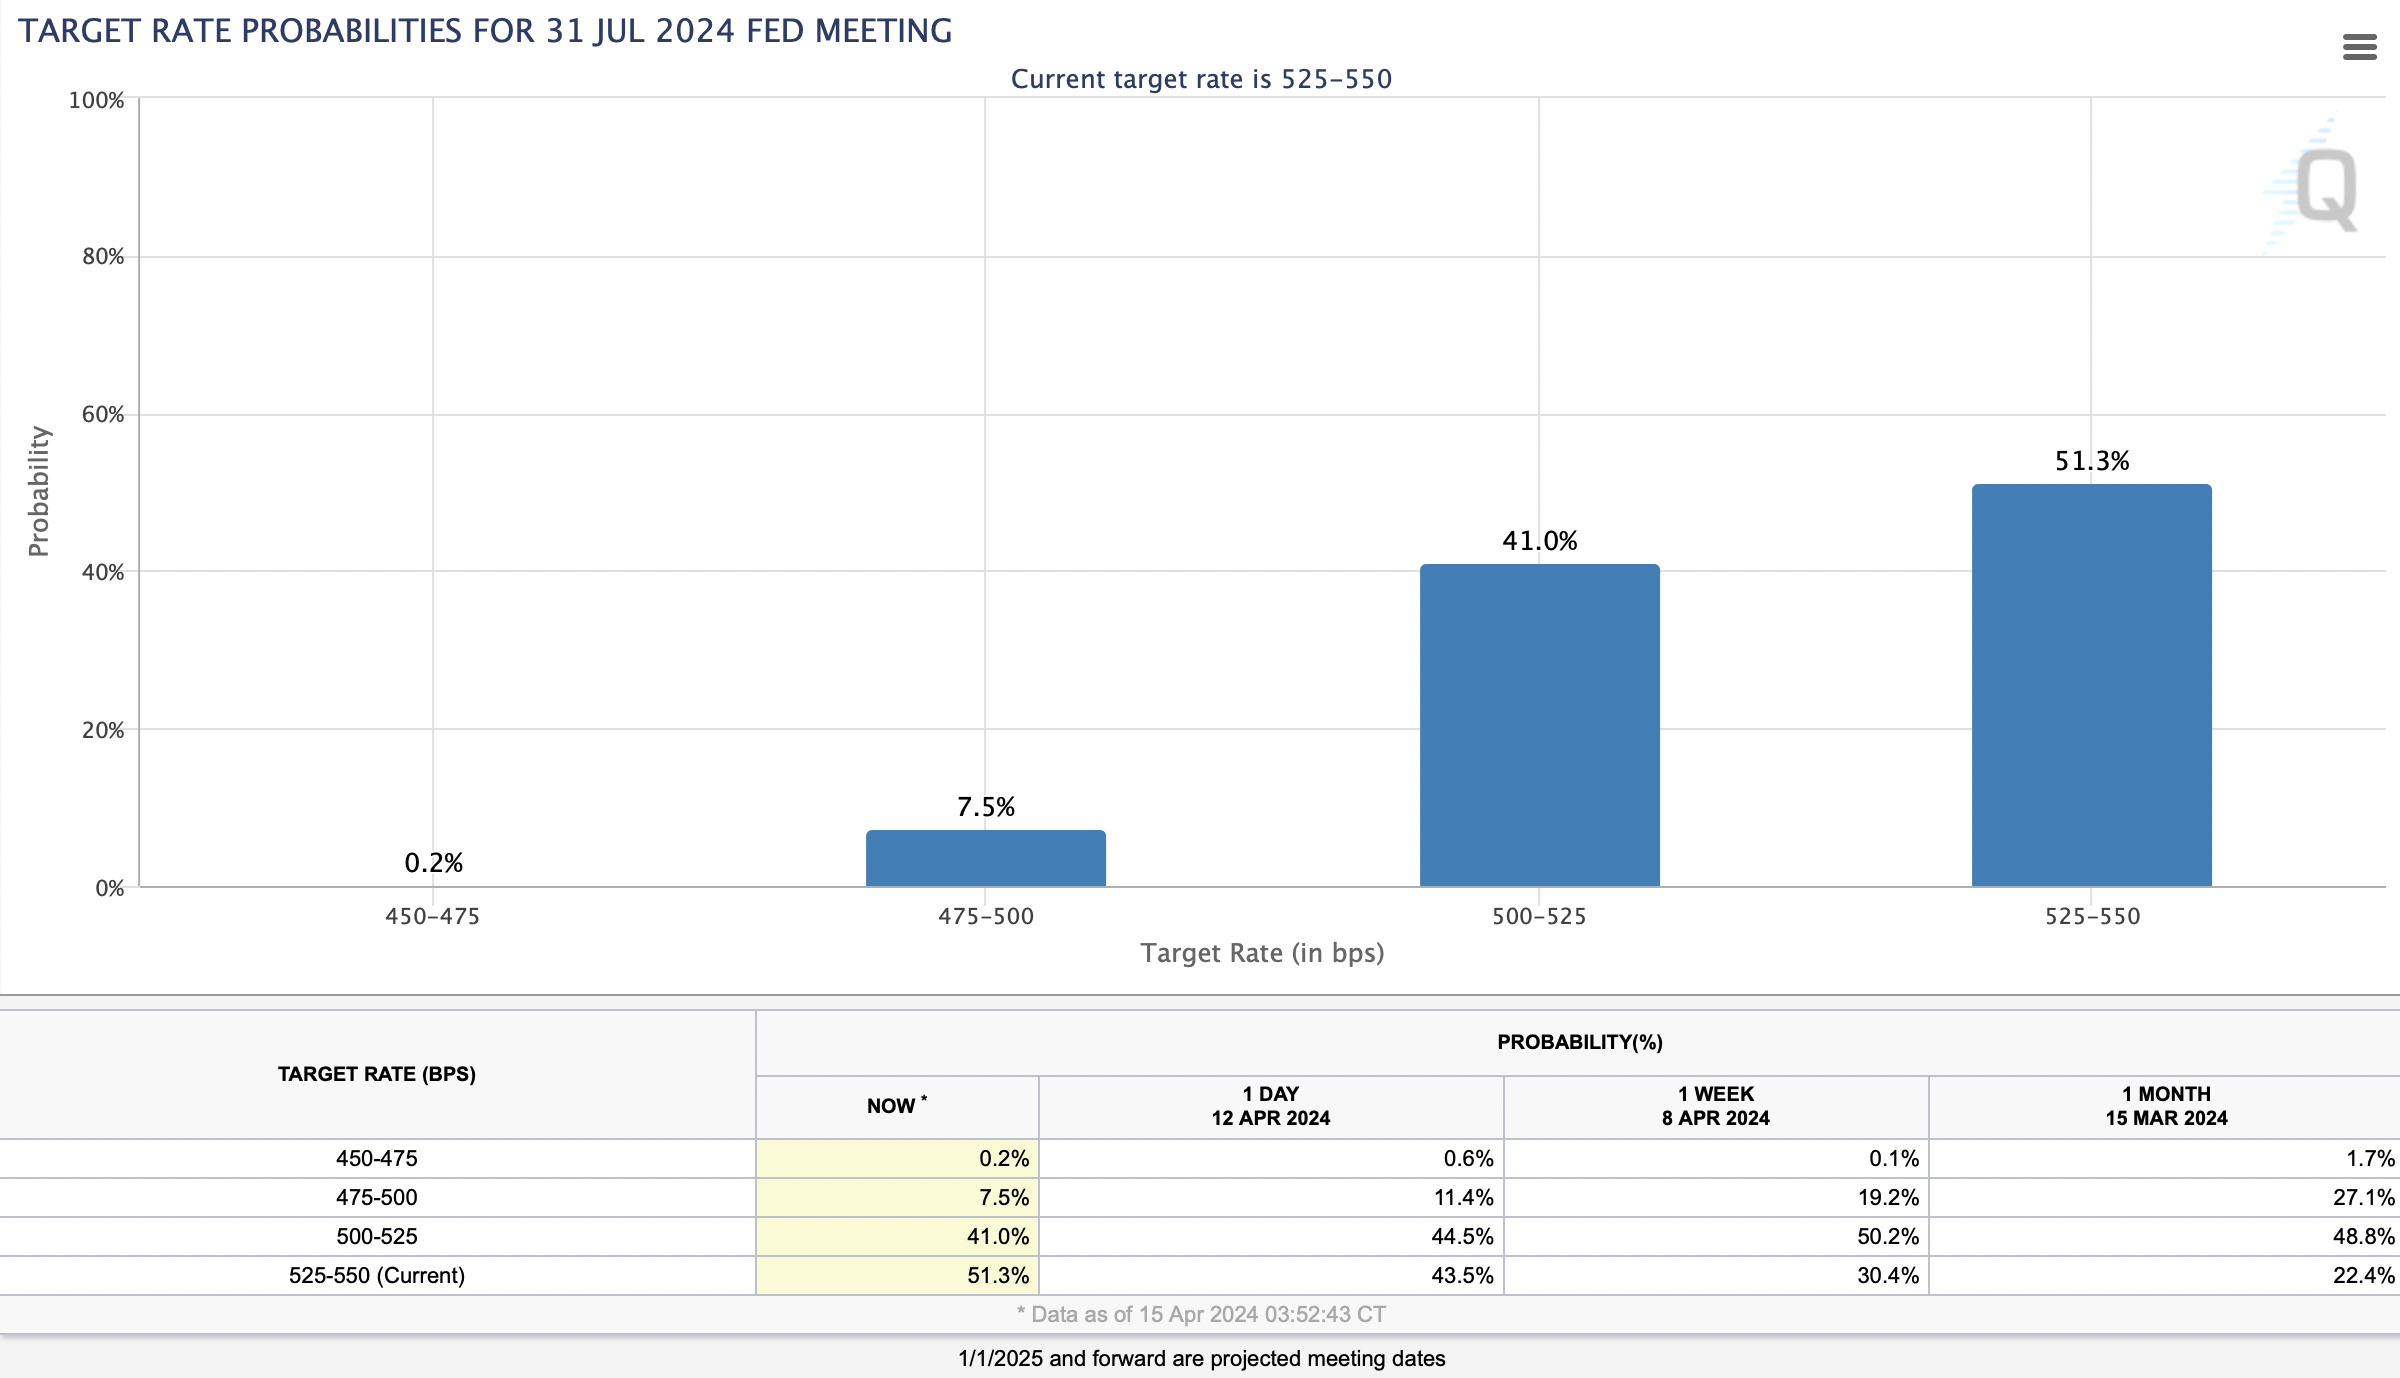
Rate cut probabilities (CMEGroup.com )
Regarding rate probabilities, the pendulum may have shifted too far in the hawkish direction. The market now has a July or earlier rate cut probability below 50%, suggesting the market expects the first rate cut to come in September. There is about a 73% probability that we will see the first rate cut in or before September, which is overly pessimistic, in my view.
One month ago, there was a 93% probability that the initial rate cut would occur in September or sooner, and there was a 78% probability that we would see at least one rate cut by the end of July.
Therefore, the odds of a rate cut occurring later may have gone too far out, suggesting there is a probability we could see more dovish expectations in future months. Of course, we need inflation to continue moderating, which would be a favorable dynamic for stocks and other risk assets.
Earning Season - A Solid Start
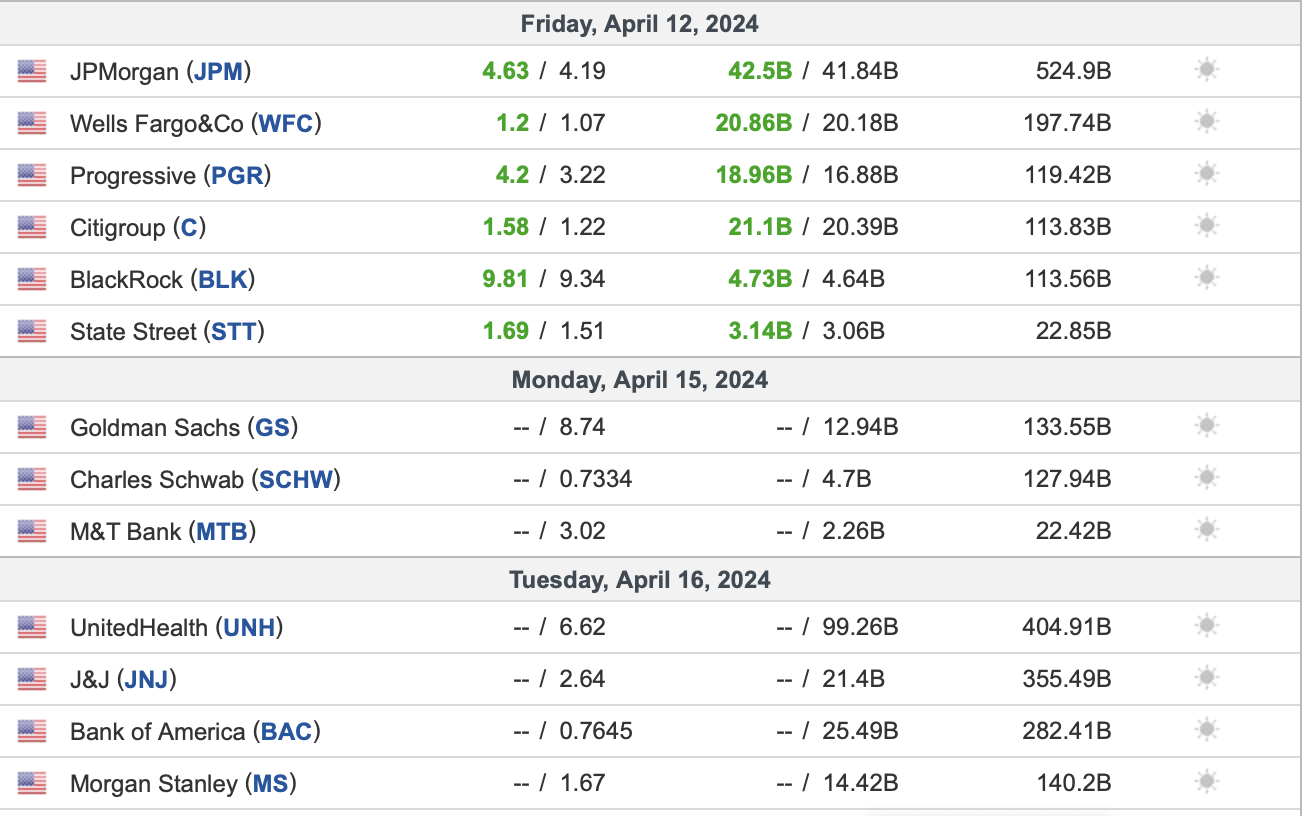
Earnings kickoff (investing.com )
We witnessed a solid start to earnings season, with substantial beats from all the big banks and financial companies. However, we saw some rises in loan delinquencies, which is a dynamic to avoid and must be monitored. This also implies that the Fed should cut rates soon to prevent a possible increase in delinquencies moving forward.
Also, the better-than-expected financial results are typically a positive prelude to the broader earnings season, and we're likely experiencing a healthy pullback into the heart of the earnings event. Big tech earnings kick off next Tuesday, and we will likely see some impressive results and FY guidance from the "Mag 7" and other high-quality names.
Valuation Check - It's Debatable Now
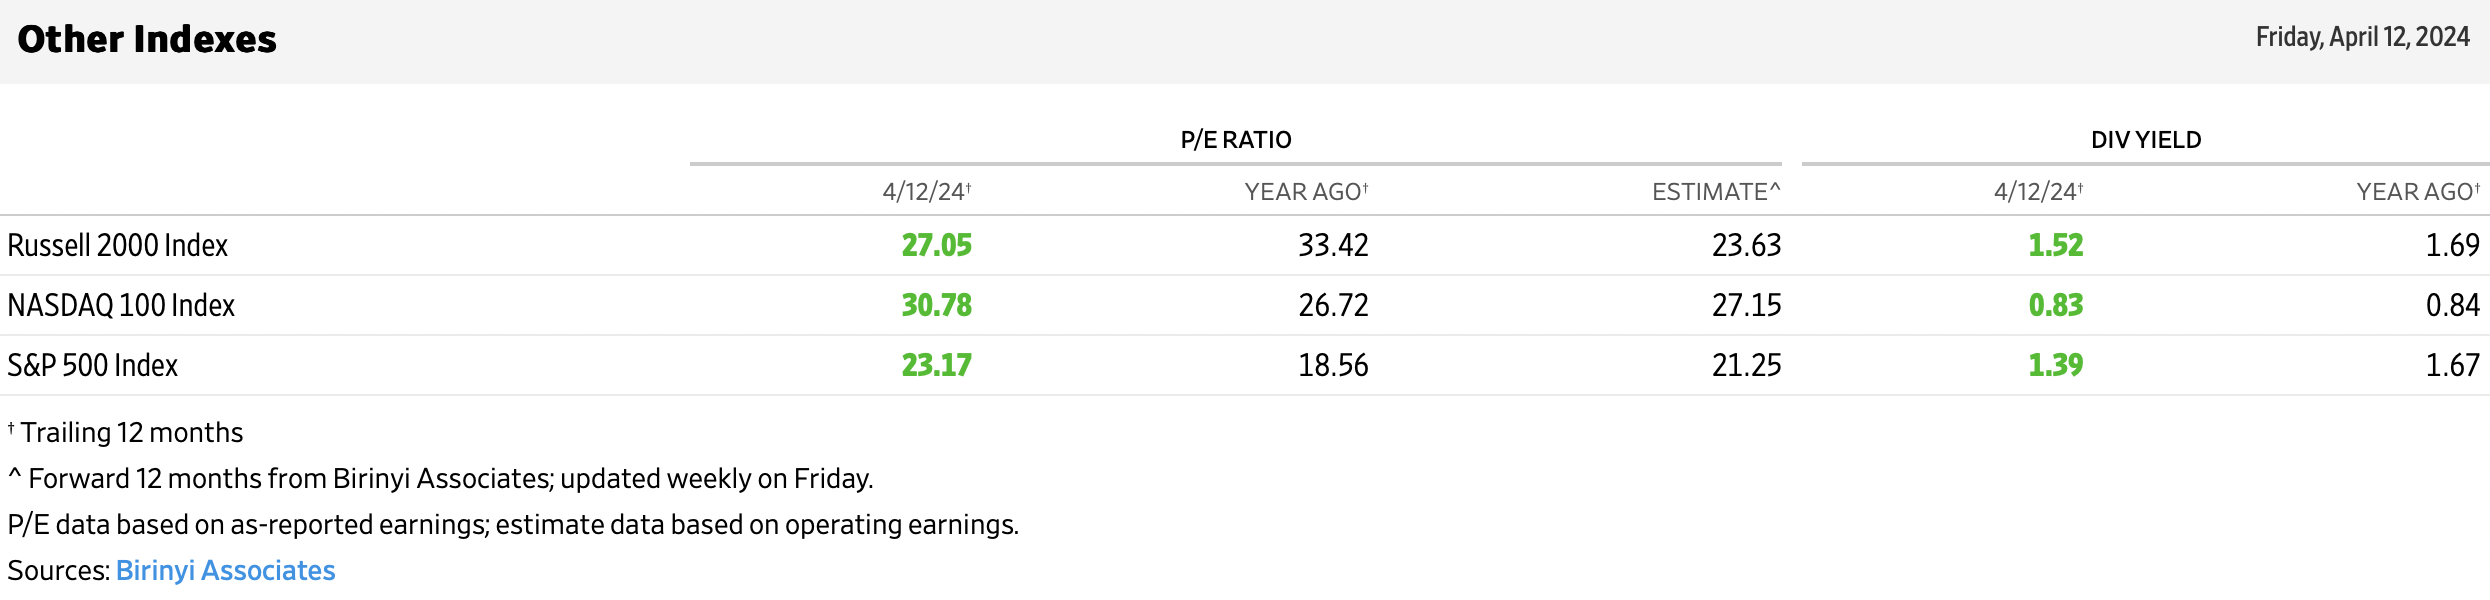
P/E ratios (WSJ.com )
With rate cut probabilities getting pushed out to H2, it's debatable whether major averages and stocks in general are still cheap here. Clearly, at 18.5 trailing EPS, the SPX was much cheaper than it is now at 23. We see a similar dynamic with the Nasdaq (COMP.IND). The dividend was also more attractive, around 1.7%, than the 1.4% now.
Still, a 21 P/E ratio is not terribly expensive on a forward basis, and the Nasdaq 100 (NDX) seems attractively priced around 27 times forward EPS. Moreover, we could see better than anticipated earnings, suggesting the forward P/E ratios may be lower than they appear.
For instance, if many significant Nasdaq 100 and S&P 500 components continue beating EPS estimates, the Nasdaq may be trading around a 25-26 forward P/E multiple, and the SPX may be around 20 forward earnings now.
Additionally, if the pullback continues, the valuations will decline further, making for an excellent opportunity to buy the dip in future weeks. If the pullback continues and the SPX declines to around 4,800-5,000, it could set the S&P 500 up for a 15-25% rally into H2, appreciating into my 5,700-6,000 target range by year-end.
Are You Getting The Returns You Want?
- Invest alongside the Financial Prophet's All-Weather Portfolio (2023 47% return), and achieve optimal results in any market.
- The Daily Prophet Report provides crucial information before the opening bell rings each morning.
- Implement my Covered Call Dividend Plan and earn 50% on some of your investments.
All-Weather Portfolio vs. The S&P 500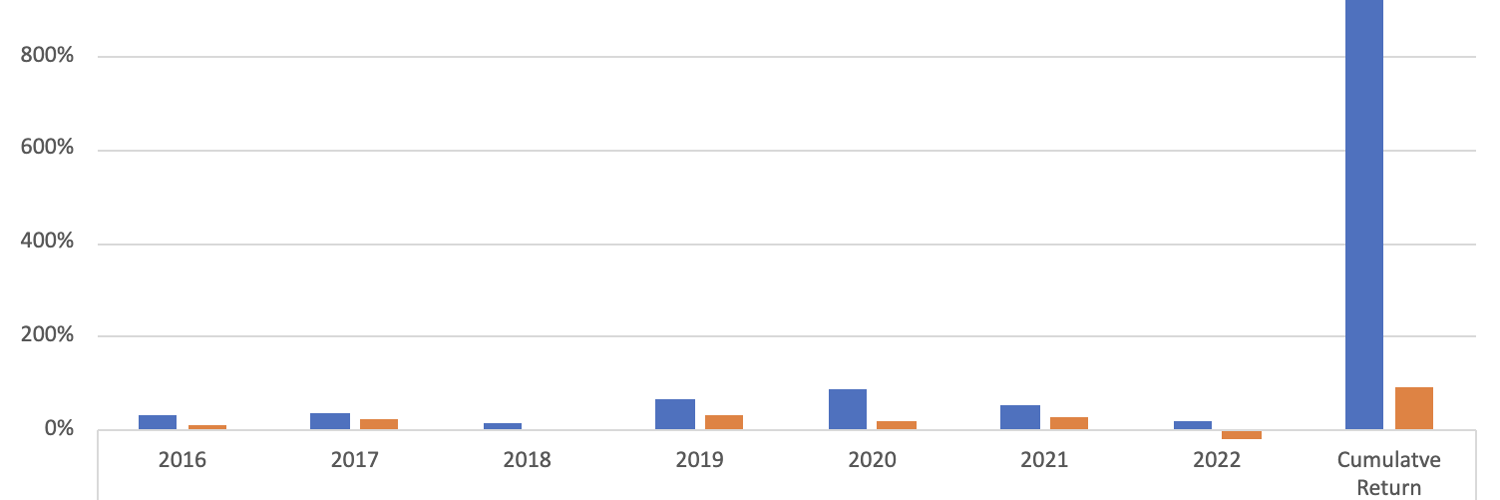
Don't Wait! Unlock Your Financial Prophet!
Take advantage of the 2-week free trial and receive this limited-time 20% discount with your subscription. Sign up now and start beating the market for less than $1 a day!